Goal Time Analysis
Ford Bohrmann
If you had to place a bet, at what minutes do you think the most goals are scored during the course of a soccer game? I was asking myself this exact question, so I decided to try to figure out what the answer was. If scoring is completely random we would expect the distribution of the count of goals scored to be roughly even across every minute of the game. Of course, it is not going to be perfectly distributed because of random errors, but every minute should have roughly the same number of goals, assuming the sample is large enough.
Data
I had a hunch that this would not be the case. Specifically, my guess was that there would be more goals scored between the 85th and 90th minutes, whereas there would be fewer in the first 5 minutes of the game. To test this hypothesis, I used data from the Rec.Sport.Soccer Statistics Foundation page from 8 years of the Premiership.
Methodology
At first I looked at the number of goals scored in the 8 years of my data for each minute of the game. However, it was clear that this breakdown was too granular; the variability was high because there just wasn't enough data to break it down in to each individual minute. To solve this, I aggregated the data in to intervals of 5 minutes. This way, the data was not as specific but it gave a clearer picture of what was going on. Below is the graph that I came up with:
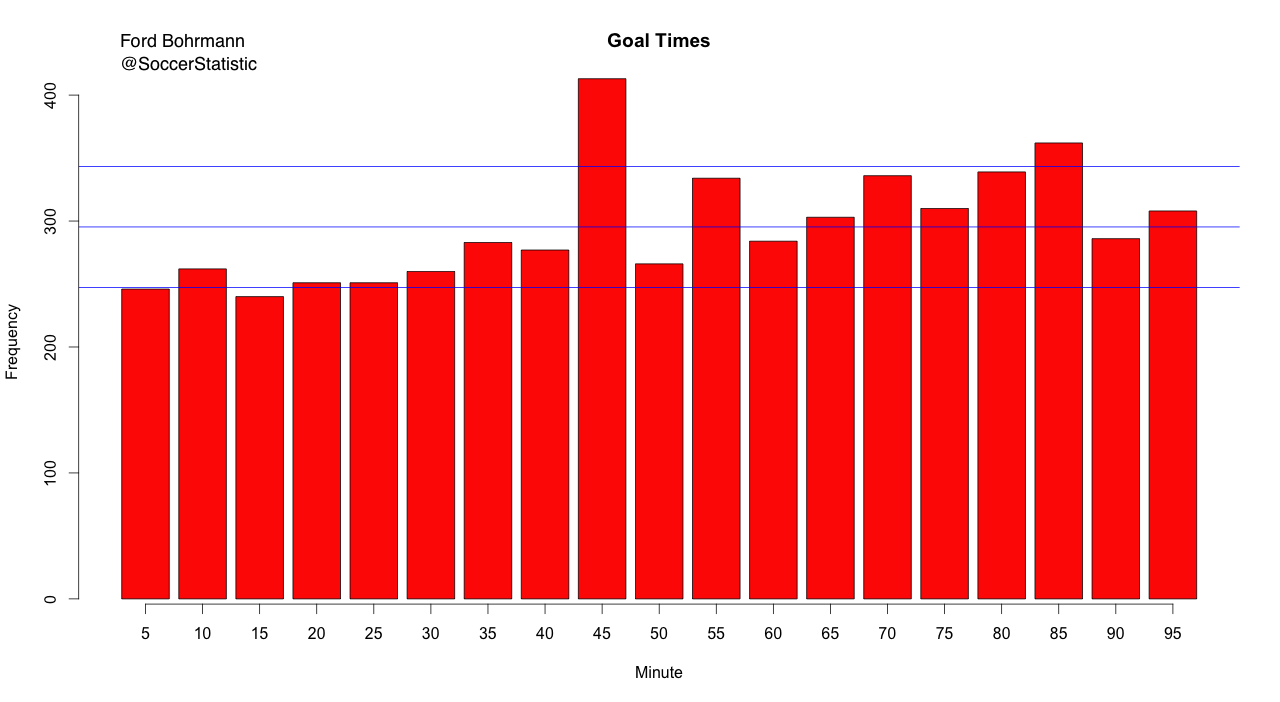
As you can see, the x-axis gives the end of the time interval. In other words, the bar over 50 on the x-axis represents the number of goals scored in the 45-50 minute time range. The y-axis is the frequency, or number of goals in that time range.
Confidence Interval
There are also 3 lines on the graph. The middle line gives the mean number of goals across all the time intervals. The top line is the mean number of goals across all the time intervals plus the standard deviation of the number of goals. The bottom line is the same thing but subtracting one standard deviation. I added these to the graph because they provide nice reference points to help determine time intervals that can be considered outliers.
Late First Half Goals
The first thing that sticks out from looking at the graph is the number of goals scored between minutes 40-45. It seems that a lot of goals are scored right before the halftime mark. This is pretty interesting, and something that I was not necessarily expecting. It is also probably the worst time to give up a goal; instead of going in to the half tied or up by one, a club would instead be going in to the locker room down by one or tied.
First Versus Second Half Goals
Another piece of the plot that is the difference between the height of the bars in the first half compared to the height of those in the second half. In the first half, the number of goals is right around the lower part of the interval. In the second half, the number of goals is around the upper part of the interval. Clearly, more goals are scored in the second half of games, which is probably not the first time someone has pointed this out.
Implications
There are a number of takeaways from this plot. First, the final 5 minutes of the first half is a vital period of time in the game. Clubs should bear down and play more defensively than usual, especially considering the fact that you don't want to go in to the half having just let up a goal.
Second, I was thinking that there could be applications to betting. While I don't bet on soccer games myself, the information could be useful for someone placing a bet on the time a goal is scored, or even when the first goal of the game is scored. If you do put a bet on it, just don't come back complaining to me if it doesn't work out!
Update 6/10/2015: It's worth noting that the goals scored in the 40-45 minute bin is likely a bit less than what is represented in the graph above. I'm not 100% sure, but it seems that the RSSSF data counts a goal scored in the 2nd minute of first half stoppage time as being scored in the 45th minute, meaning the numbers are likely inflated for that specific bin. Thanks to Jack Heer for pointing this out in the comments.